© 2023 Melvil Lardinois
741 New South Head Rd, Triple Bay SWFW 3148, New York
Project management, Recruitement, Software architecture, UI/UX Design

2020 - 2022
WISOGIS is a B2B SaaS online tool created in partnership with wind and solar experts from Tractebel-ENGIE. Based on projects' inputs, the application generates a high-resolution heatmap describing the Levelized Cost Of Energy (LCOE) anywhere on the globe.
Official website
In 2021, I met two engineers at ENGIE’s workplace, we got along well and agreed that it would be fun to work on a project together. A few months passed after we finished TRiceR, they came up to me with the idea of this app and of course, I accepted the opportunity.
This was a technically harder project than TRiceR but it was also easier in the sense that I already had a team ready and we had much more cloud experience by then.
One of my main goals with this project was to prove that we could re-use a lot of what we learned to make an even better app, that my team had the commitment to be doing this long term and that we didn’t just get lucky the first time.
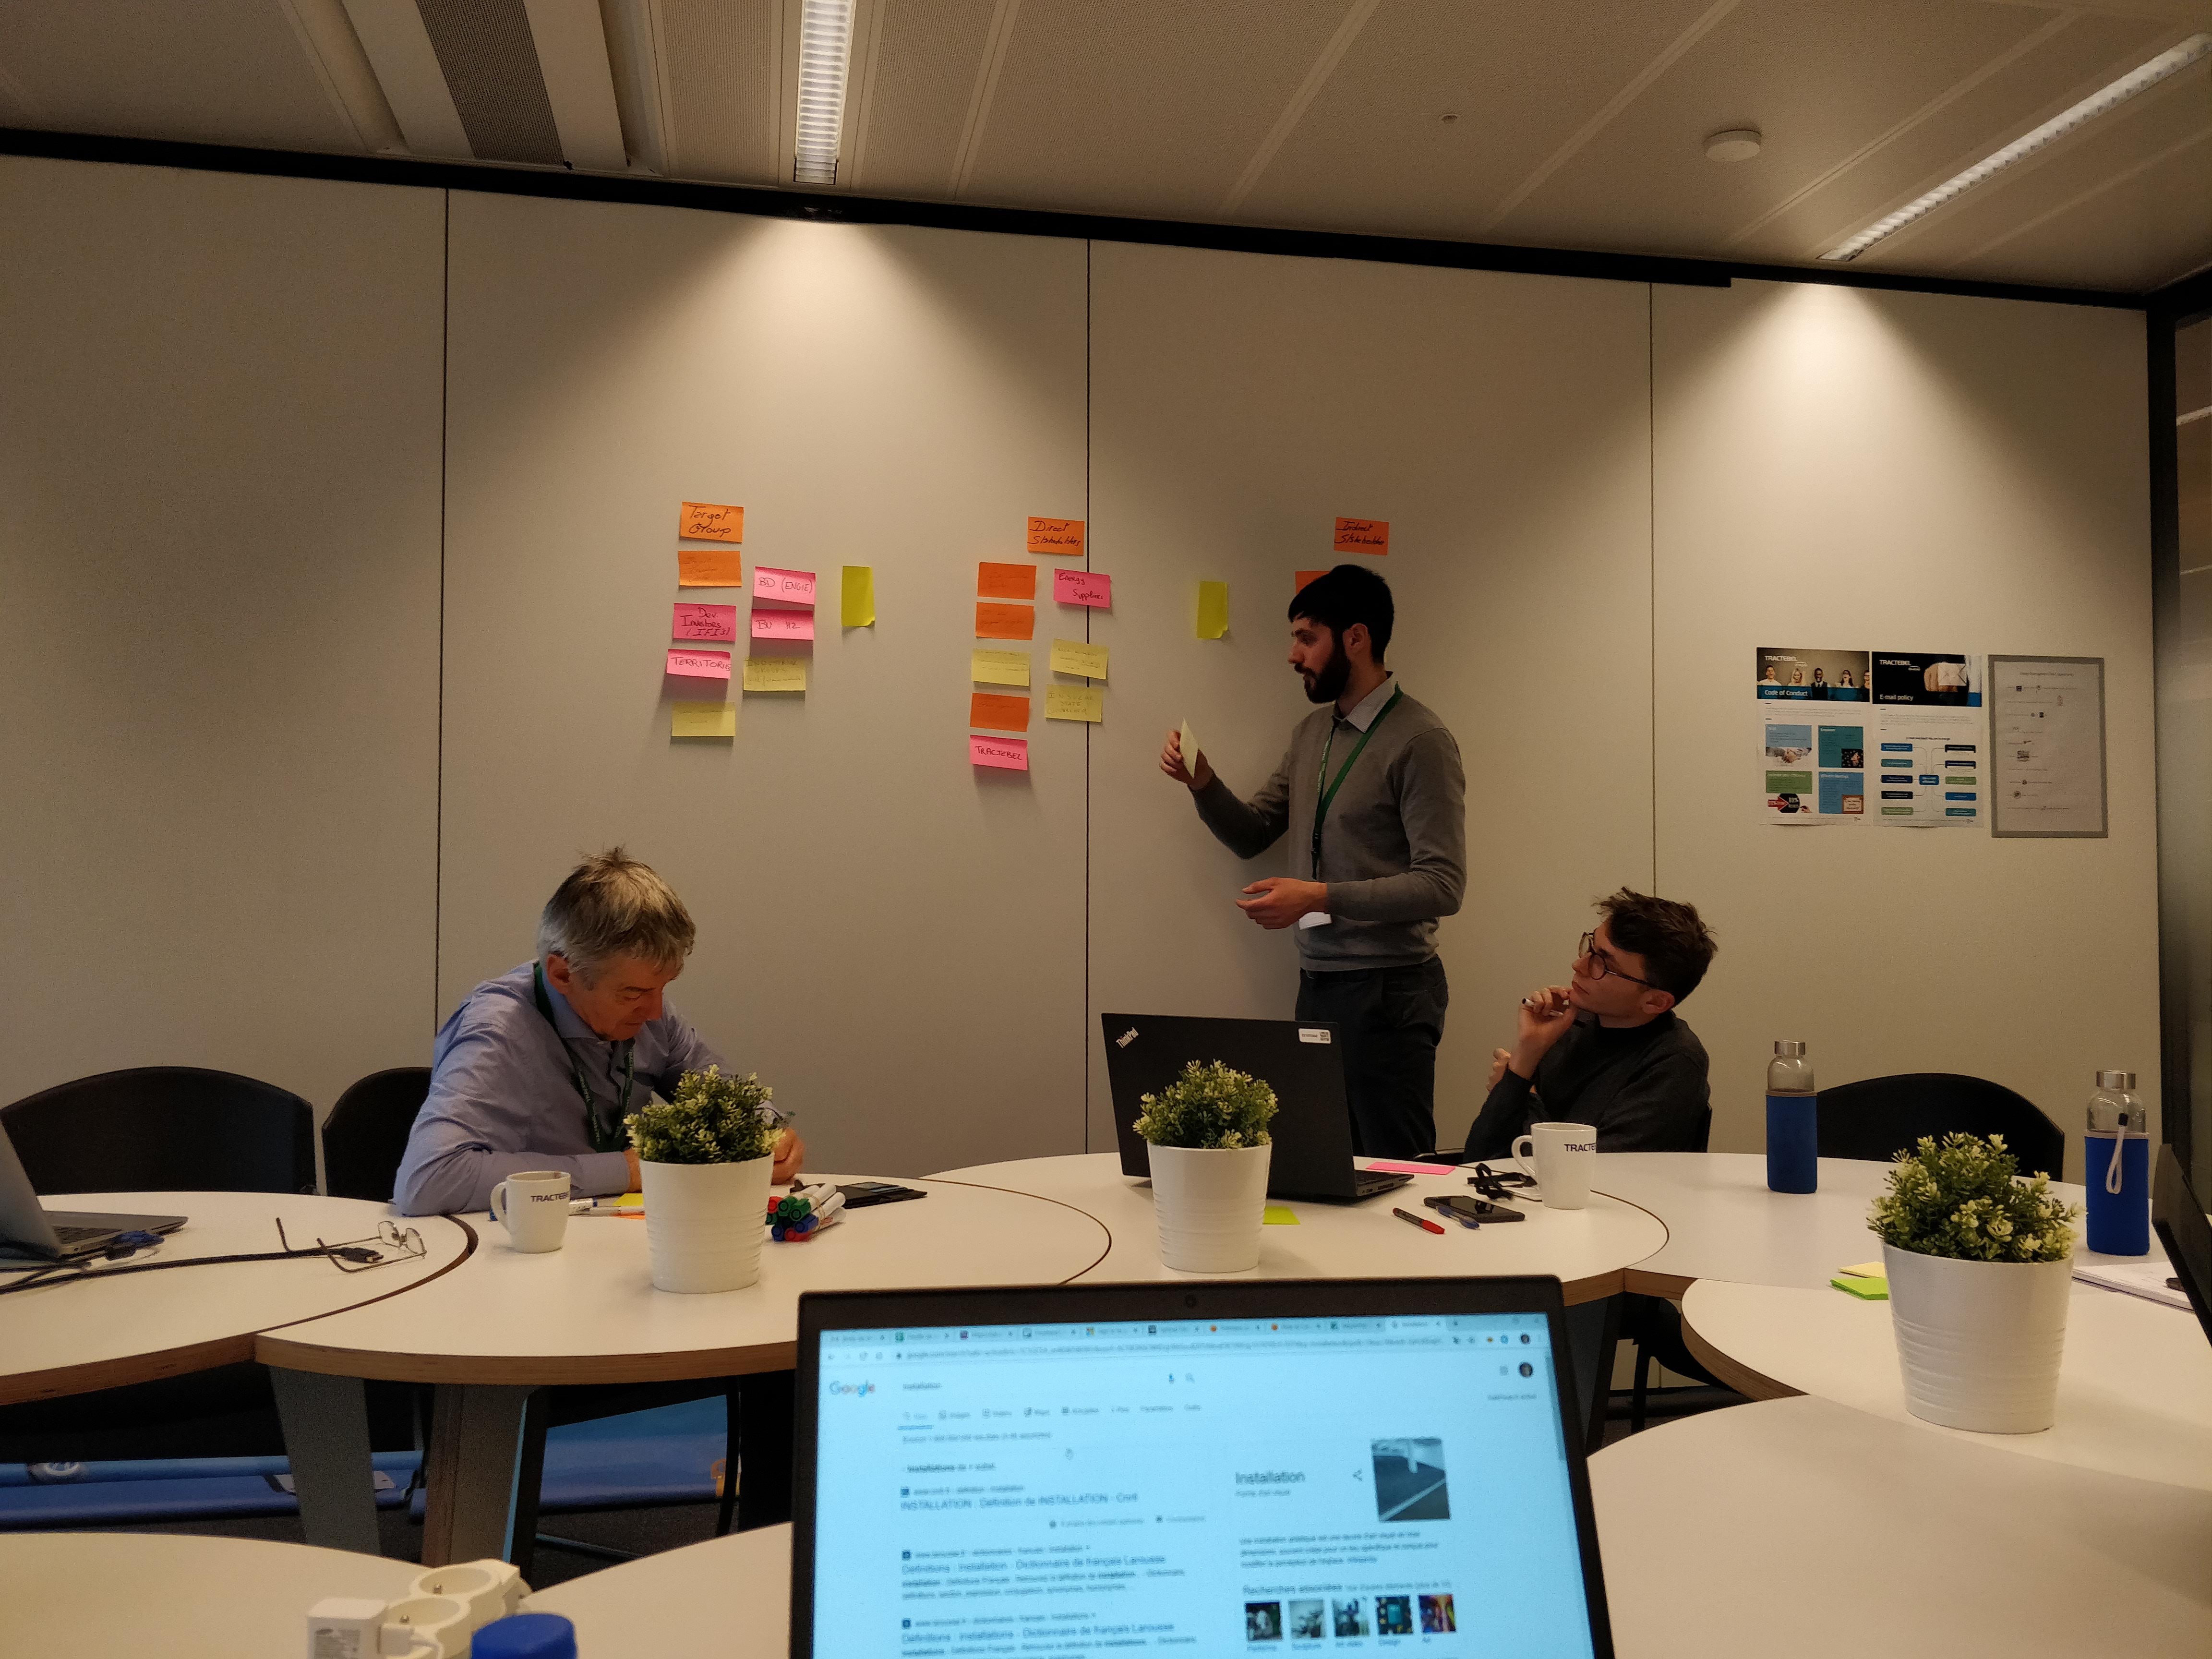
Business plan meeting
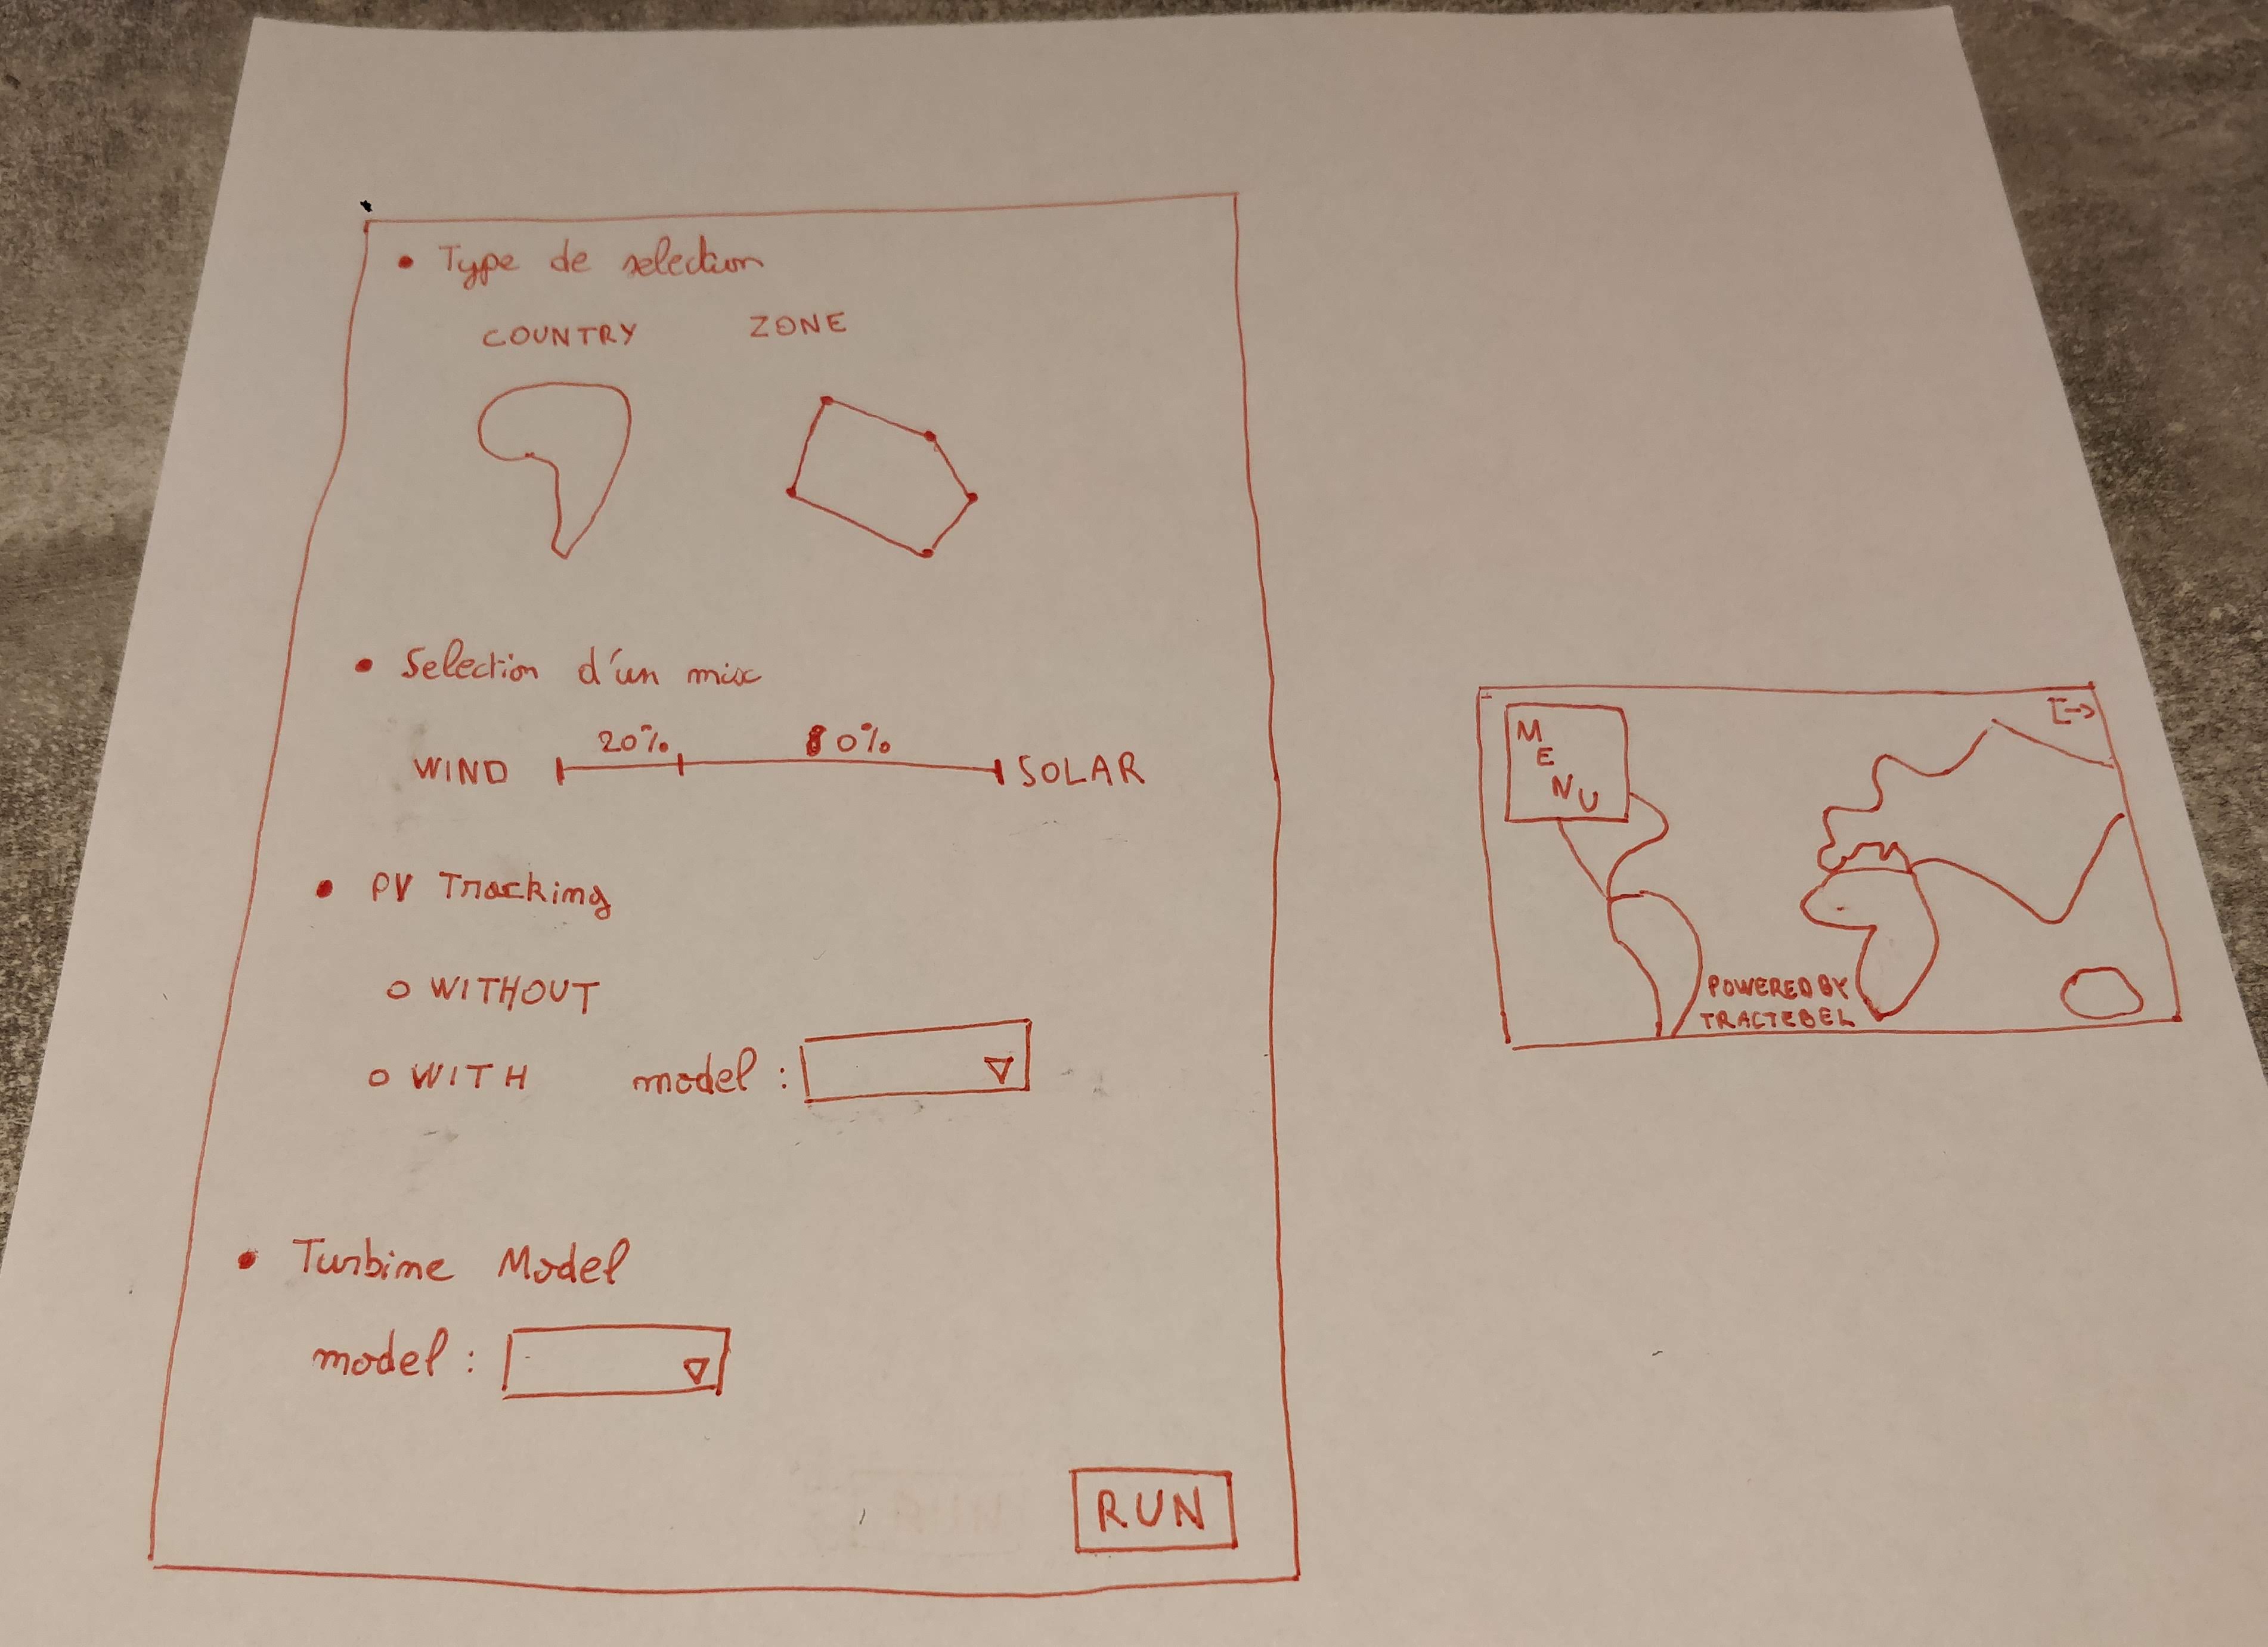
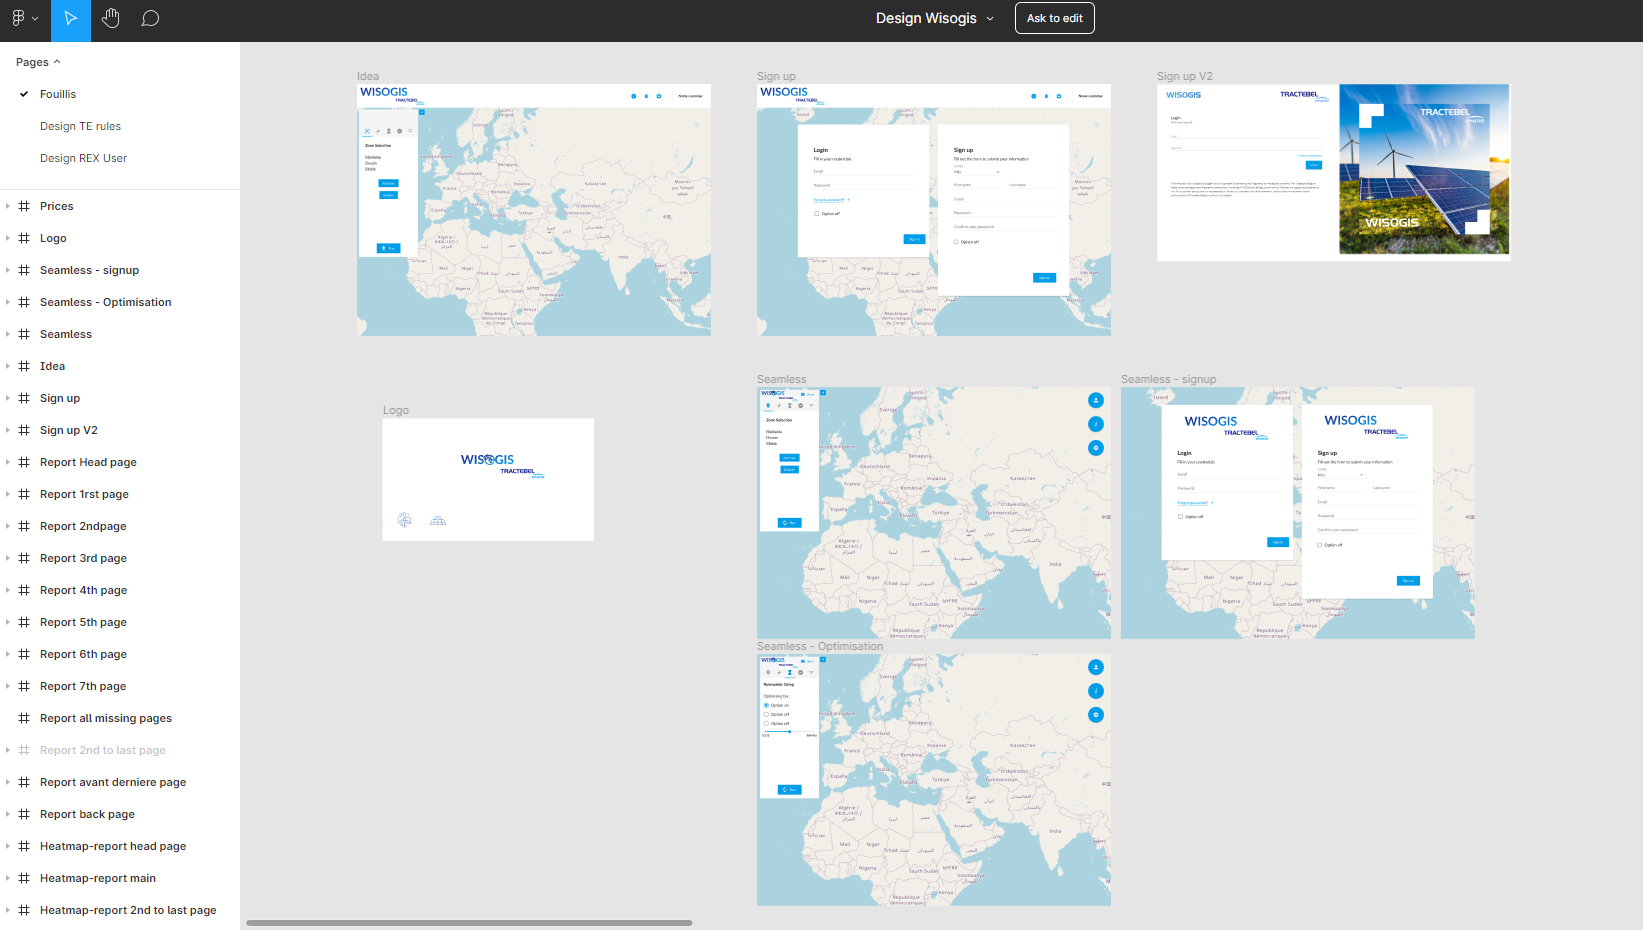
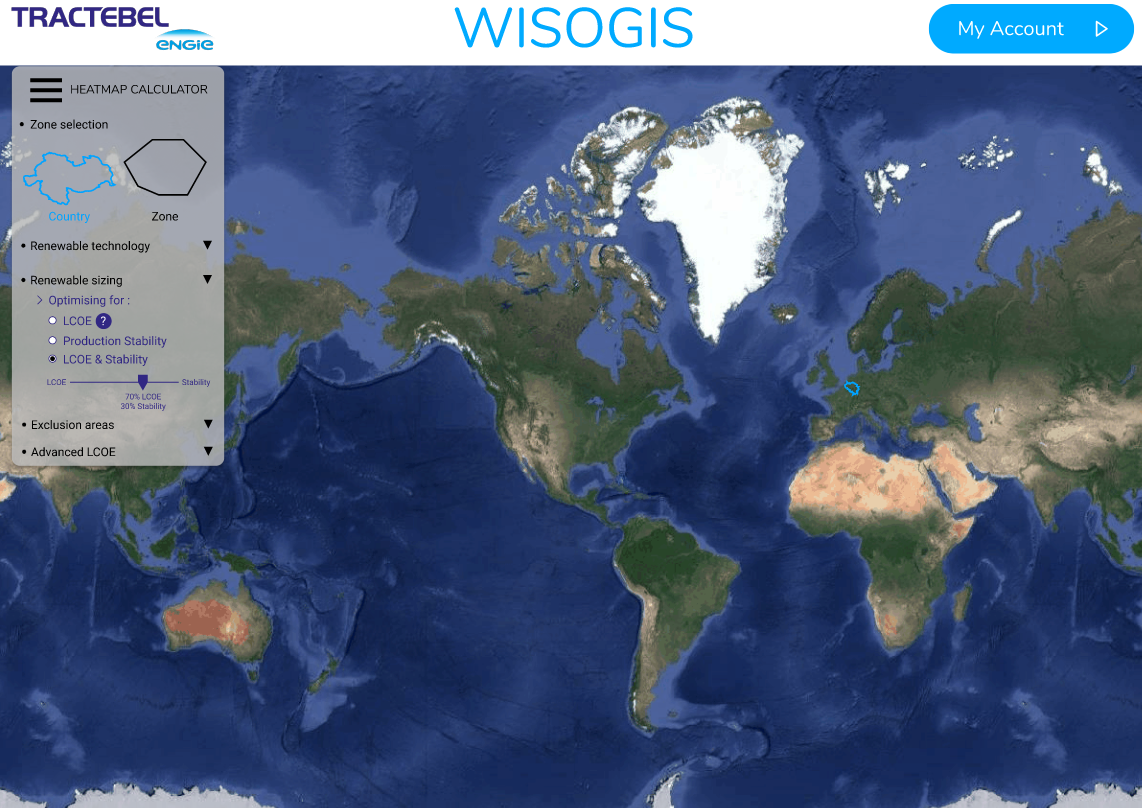
The interface was pretty straightforward to design. We started the project as a fork of Kepler.gl (which is a data vizualisation application built by Uber) so we re-used many of the existing design elements. The main point of focus was on the custom menu as the user will spend most of his time setting up calculations and adjusting configuration values through it.
Paper
Figma prototype
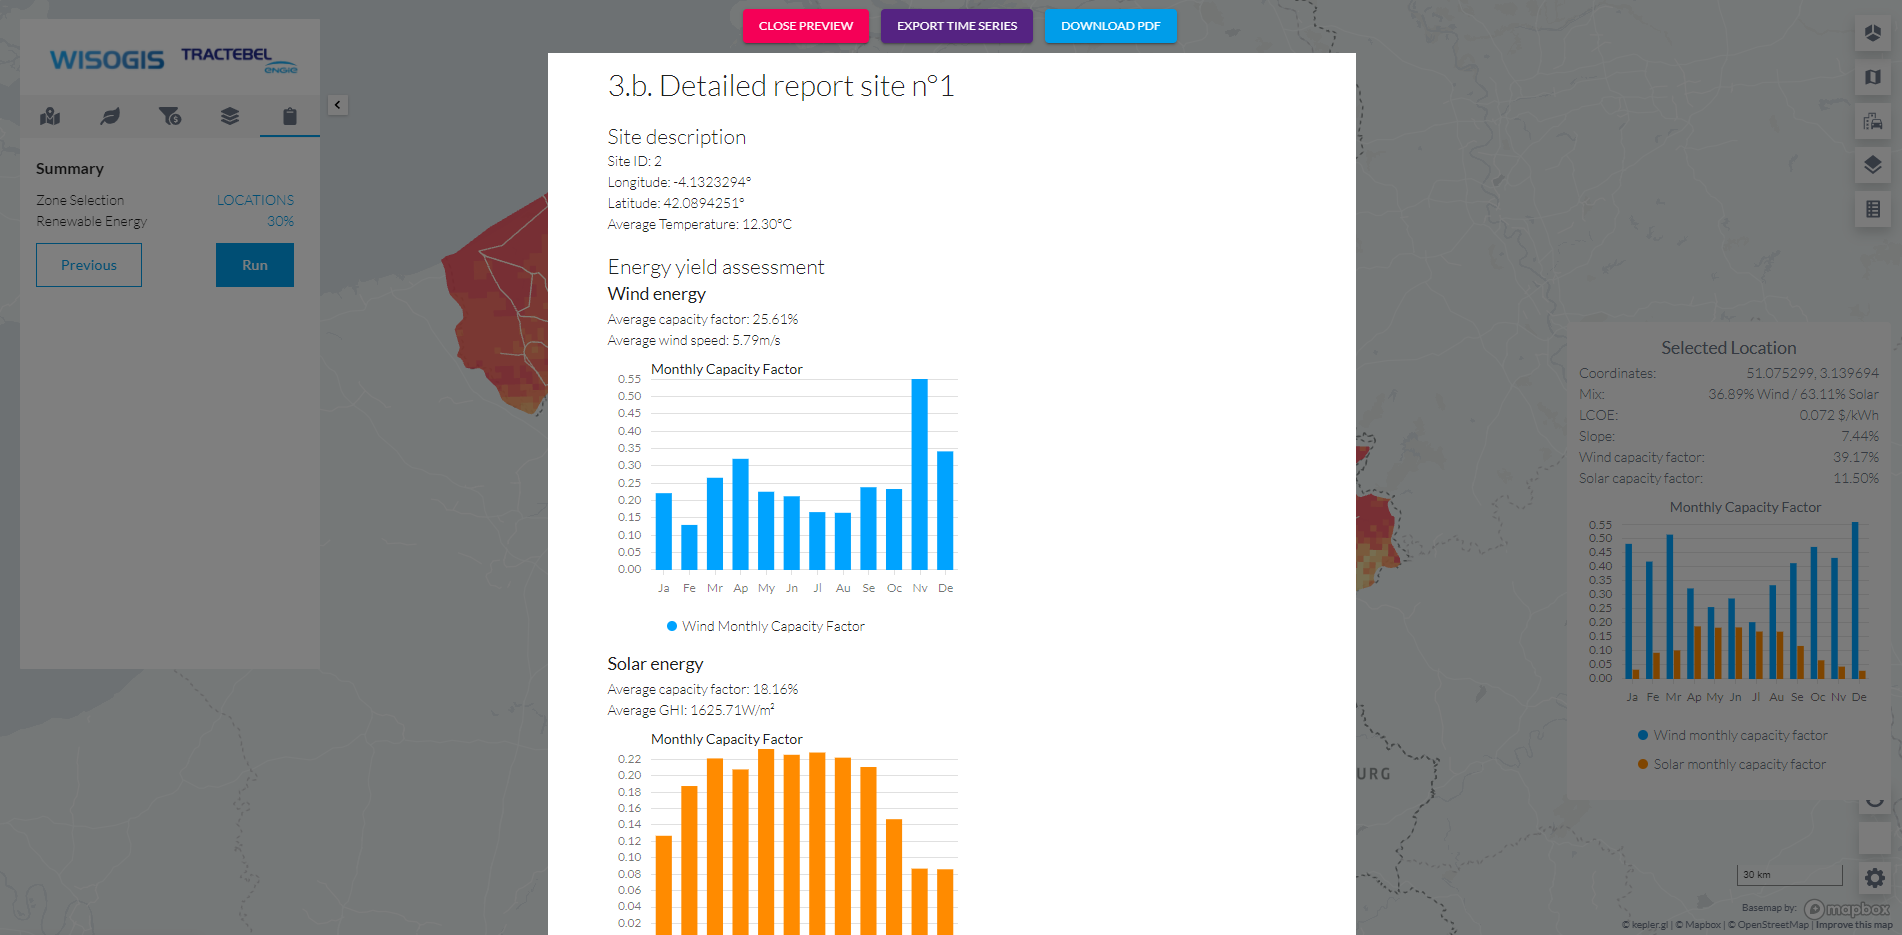
Frontend result
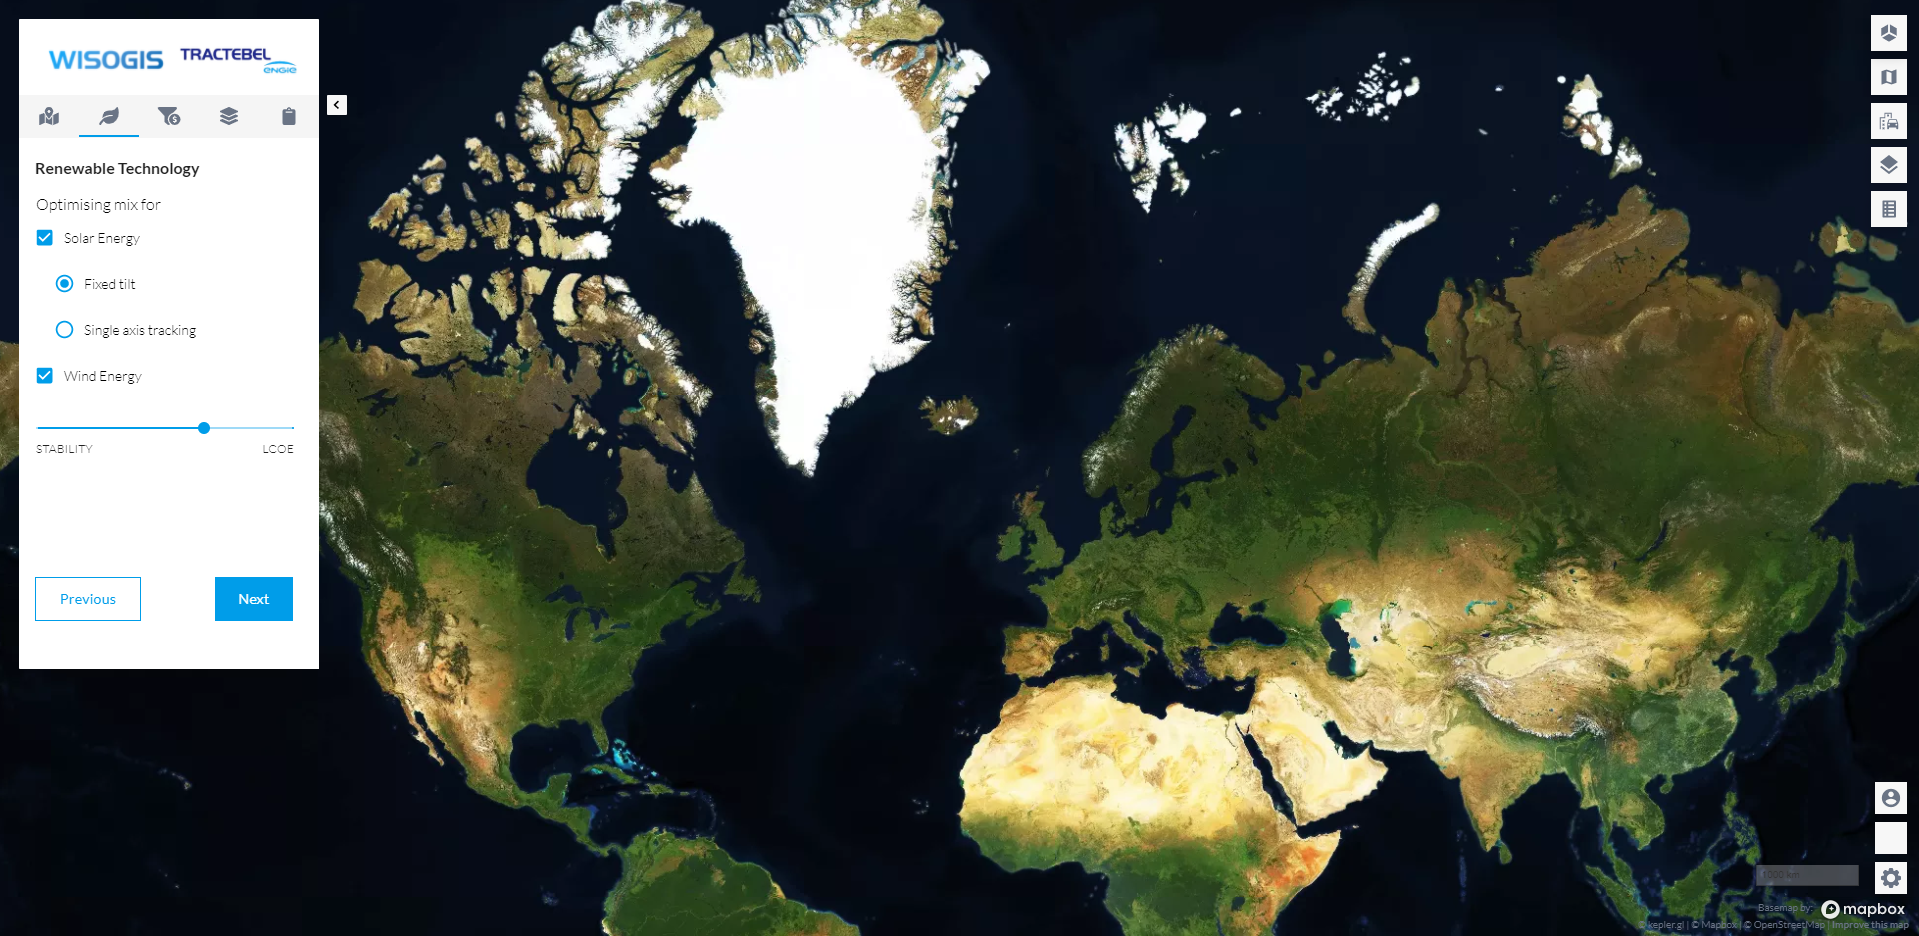
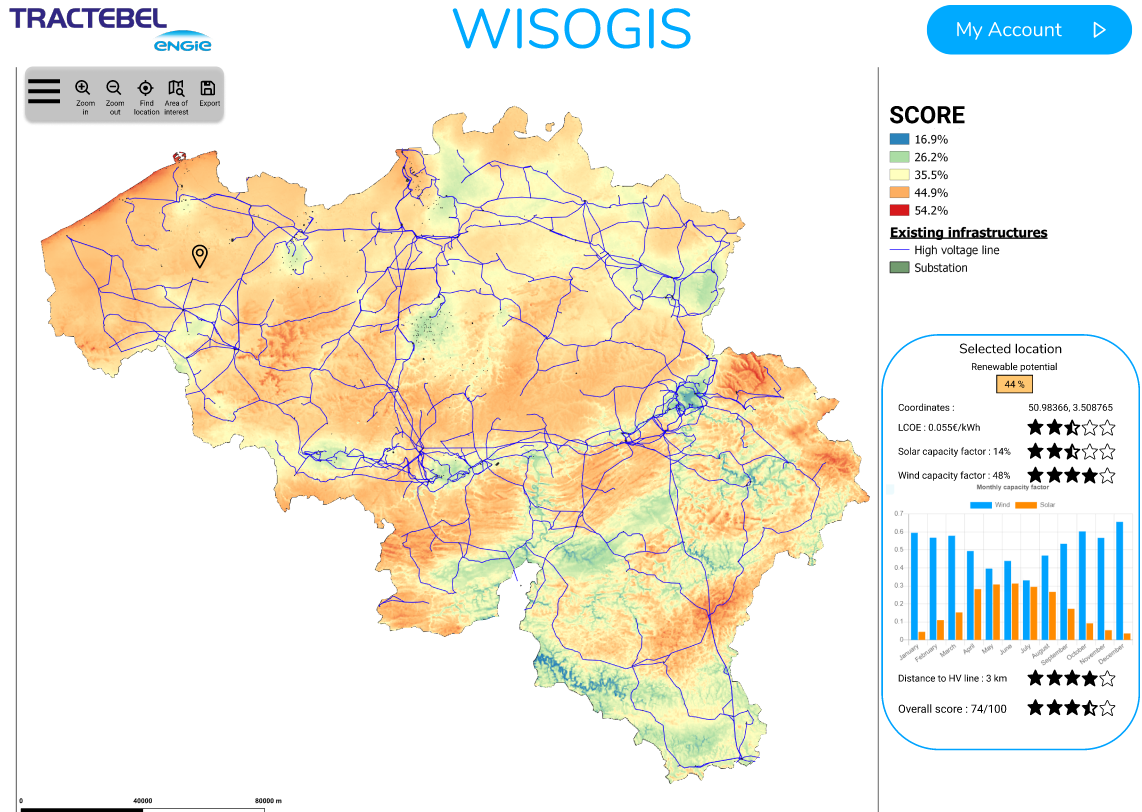
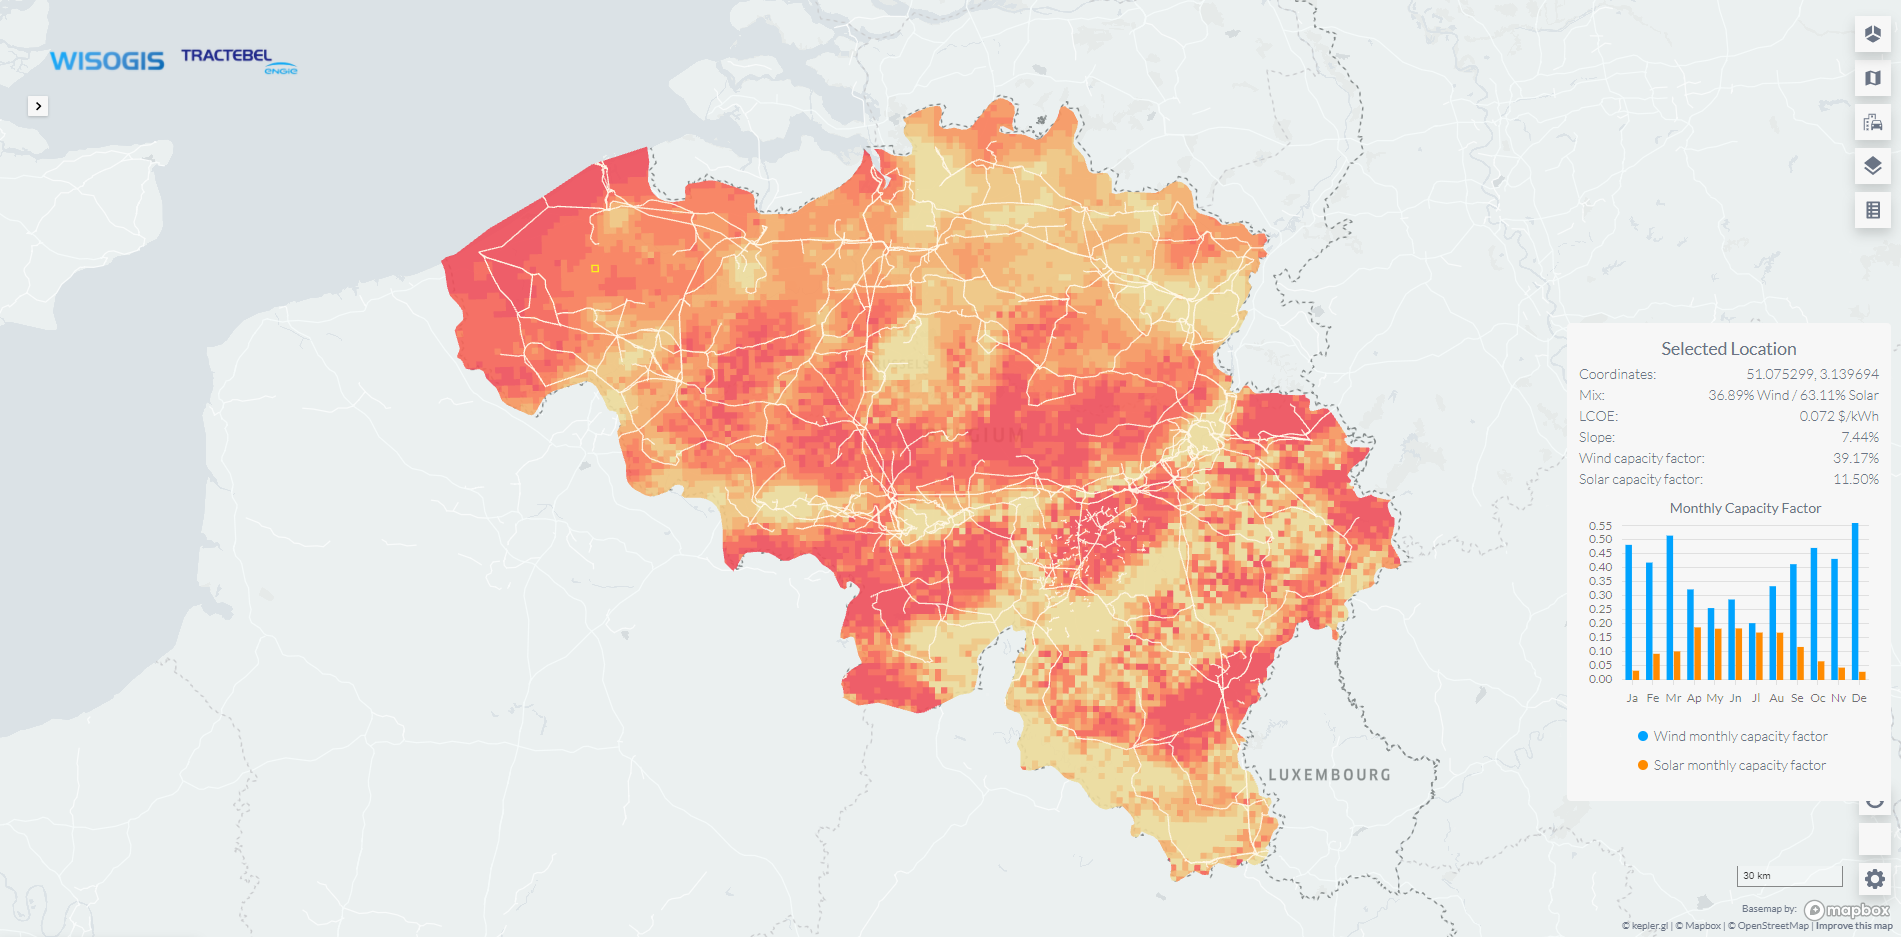
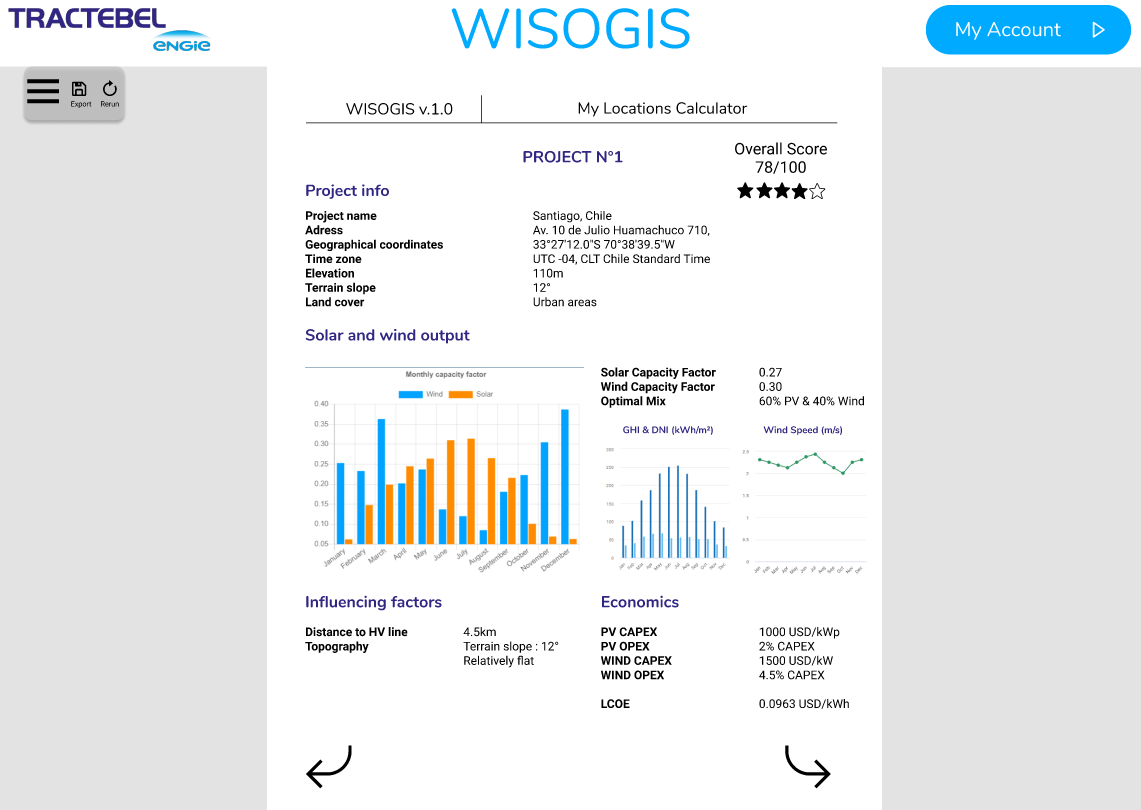
Here is a summary of the major technical challenges we faced and how we solved them.
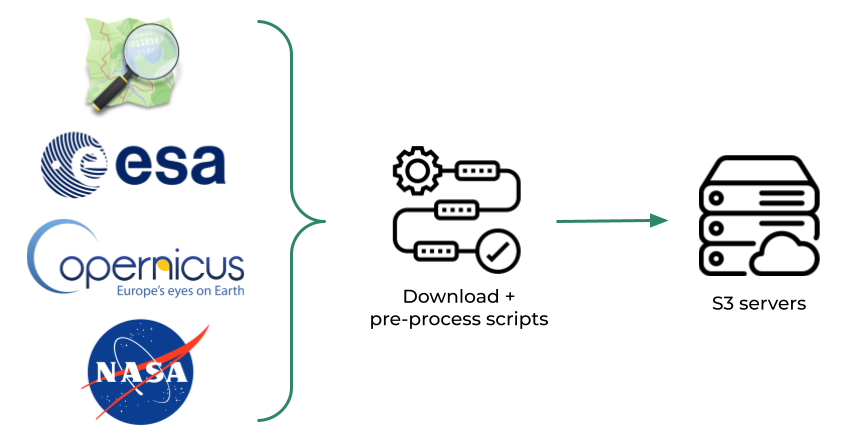
Problem 1: Gathering several TB of geographic map data from different sources (NASA, Open Street Map, Copernicus satellites, Global Wind Atlas...) and then pre-process this data to homogenize the datasets in order to simplify further backend calculations.
Solution: Unfortunately there was no easy way to get around this time consuming issue. We couldn’t rely solely on API accesses because any time any of the APIs would be down we wouldn’t be able to fulfill our calculations. So we had to download all the data manually and store it on our own servers. We wrote scripts to automize this process as much as possible but it still took us 3-4 weeks to complete this task.
Problem 2: Now that the map data are ready, they can be sent to the web application based on user’s request but some areas have very dense layers, like forests in Australia for example. That specific data set would be 2.5GO which would take a long time to download for the user and then would cause performance issues in the web application (because most graphic cards don’t have the power to process that many polygons).
Solution: The key was to trim down the dataset size by reducing its accuracy manually, using a geometric simplification algorithm. For example, instead of having 4 small polygons next to each other, we would combine them all together in one. Moreover, we automatically apply a “zoom out” factor based on the size of the area where we need to display the data set. The “zoom out” algorithm allows us to configure how substantial the geometric simplification will be, so we can still aim for great accuracy in comparison to the original data set without compromising performance.
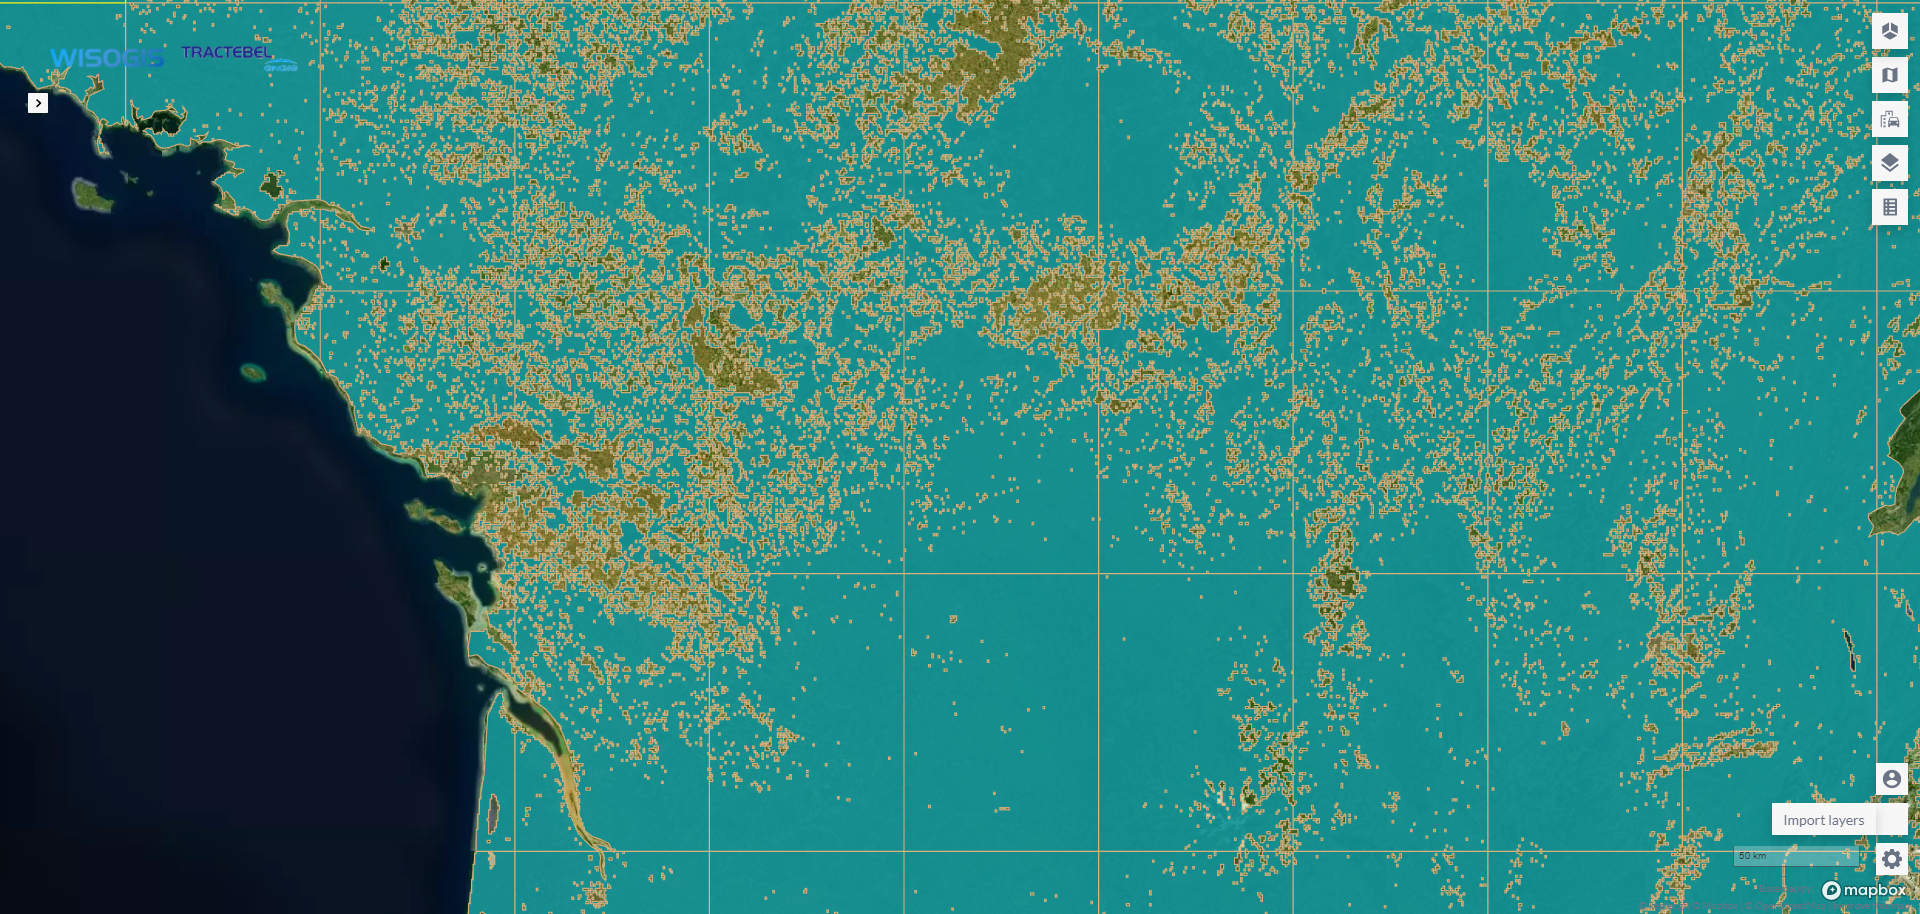
Here is a visual example of the geometric simplification (the original file was 350mo).
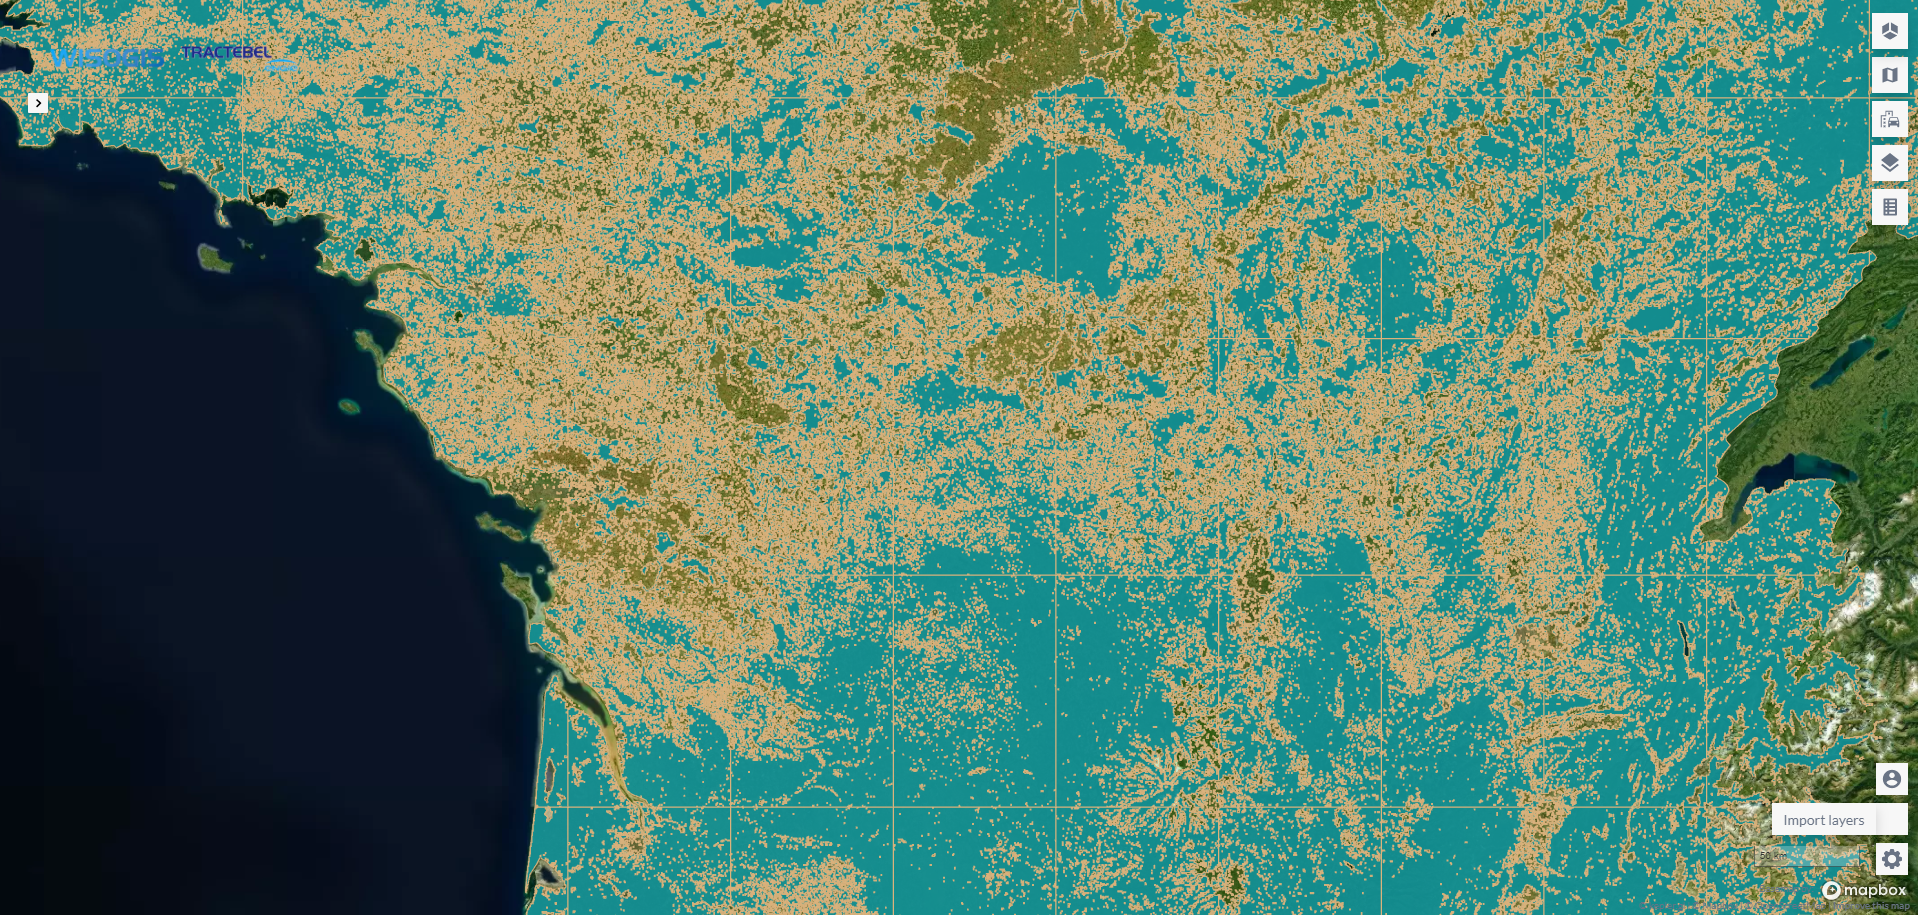
Forests in France (blue), zoom out x4
file size: 51mo
Forests in France (blue), zoom out x8
file size: 10.5mo
Problem 3: The map data results and the financial model take 14 hours on average to calculate on a regular computer. It isn’t possible to expect users to wait that long to receive their results.
Solution: We used a very similar approach than with TRiceR. We did a lot of code optimization and leveraged the power of 2000 cloud servers (AWS Lambda) to process most calculations in parallel and reduce the waiting time from 14 hours to under 5 minutes.


This part will further detail the “cloud” as it’s still a quite obscure technology for most non-technical people. The cloud I am referring to are physical servers located in warehouses all around the world. They usually look like this :

You can access these servers remotely through different providers, like Google Cloud, Amazon Web Services (AWS) or Microsoft Azure. My personal preference is AWS because it was the most popular provider at the time I started learning cloud tech. You have the choice to either use services that are already made available by AWS (called “micro-services”) which you’ll pay based on usage time, or you can upload your own code and distribute it to the world by hosting it on servers.
Moreover, the physical location of these servers matters as the farther you are from them, the more latency your applications will have. It’s up to you to decide which location will host your code and data, so you can choose the best fit for your use case. For example, most of the time we host our apps in the Ireland (eu-west-1) region.
There are many ways to design the architecture of tech solutions and cloud services are being updated all the time so it's difficult to always have the most optimized build possible. As long as the dev team is comfortable with the different tech, that monthly costs are not exceeding your budget and the security is on point, you probably have a solid setup.
Let's get into the details of the services we used for Wisogis and how they interact with each other. Screenshots of the interface of these services are displayed to help understand how they work.
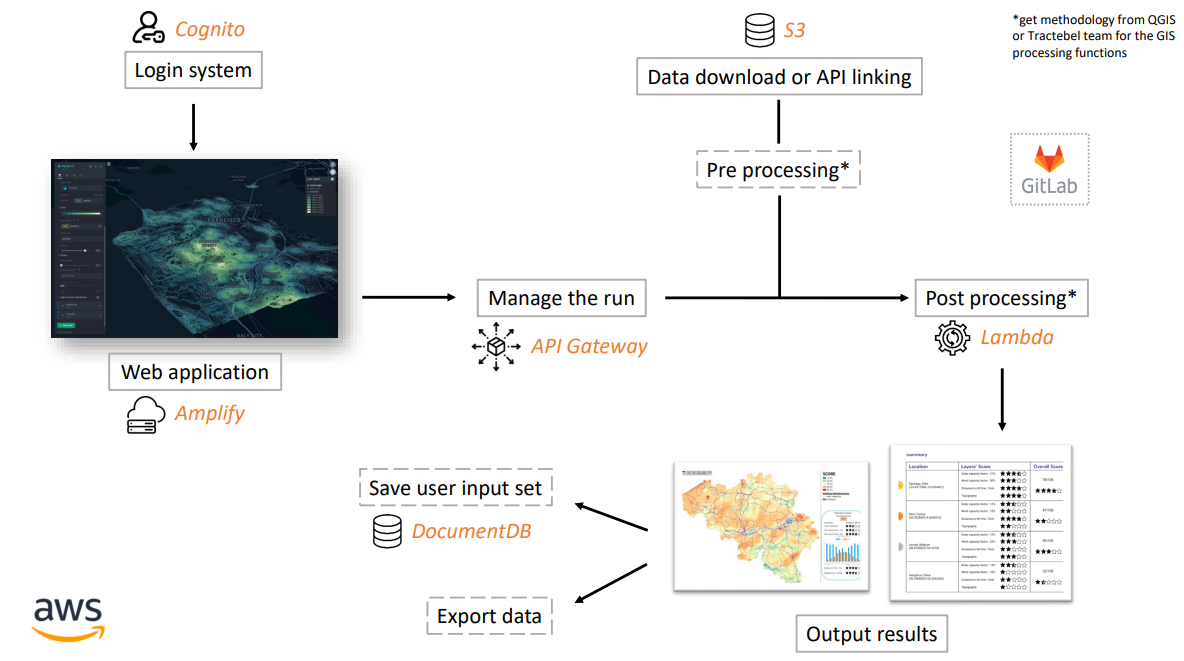
Wisogis cloud architecture
First we use Cognito for user management and the login system. It is simple to create a new user through the interface and the service is directly connected to our frontend login page.
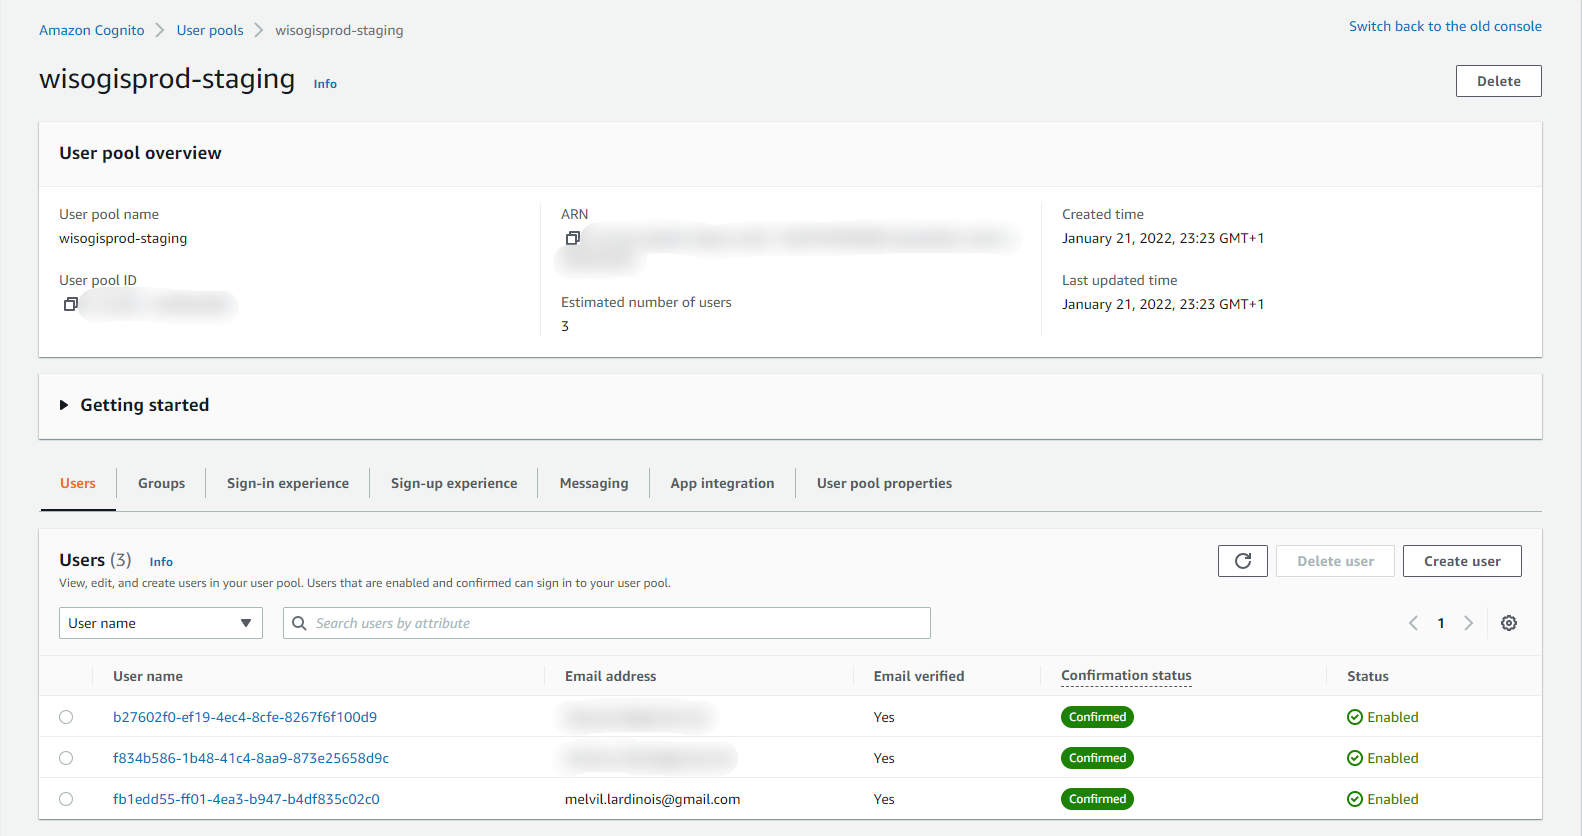
AWS Cognito
Amplify is the service that allows us to host the frontend code and distribute the application to the internet. Moreover, there is a configuration file to set up in order to tell to AWS where to find the addresses of all the services we are using to make the application work.
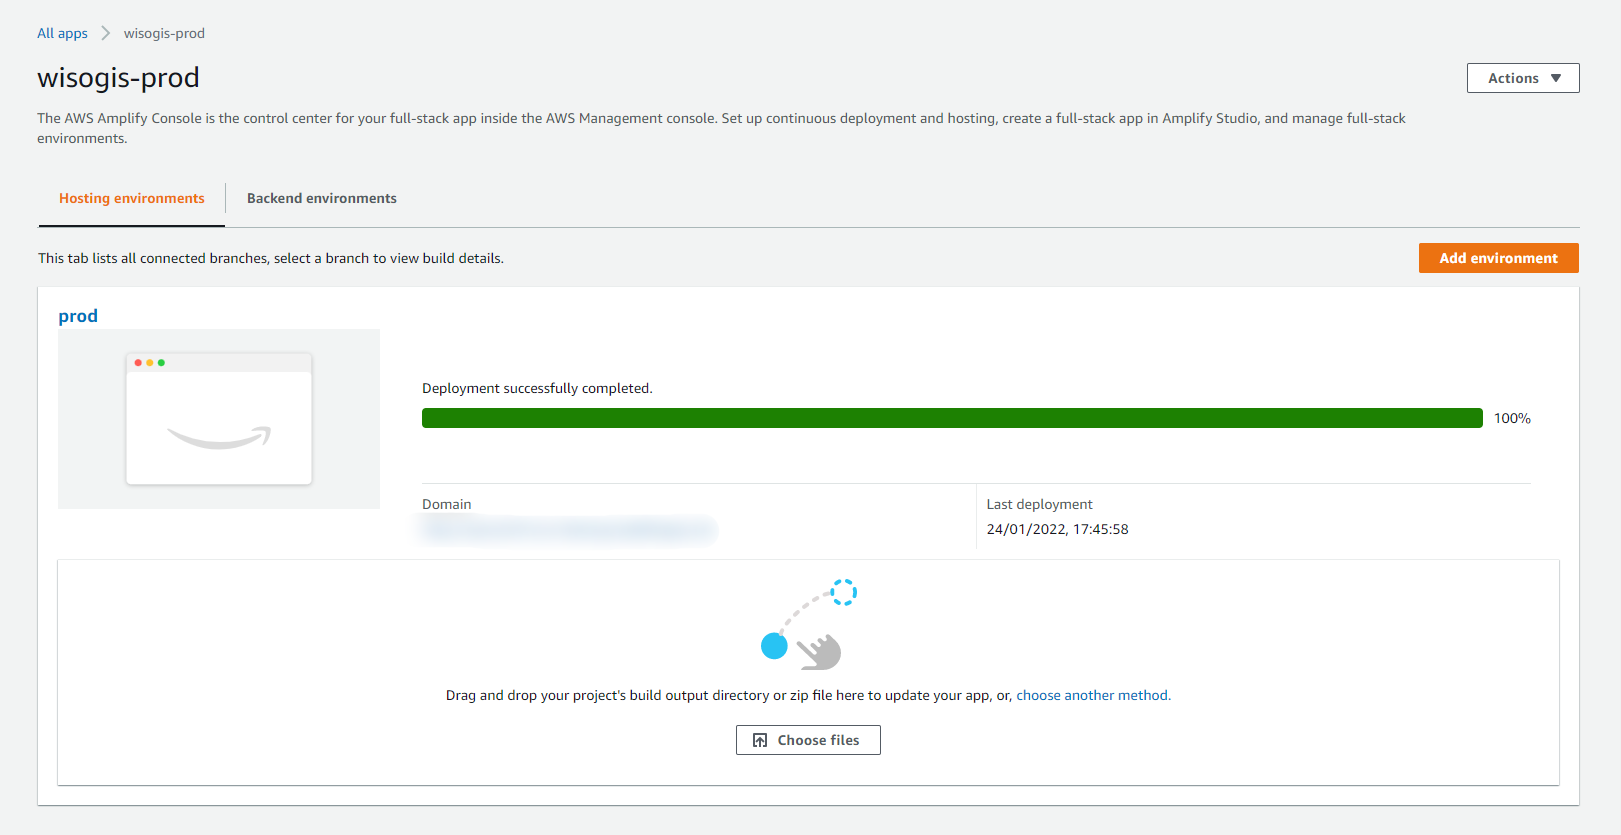
AWS Amplify
Every transmission of information between the frontend (user interface) and the backend (calculation algorithms) has to go through the API. This is where you can write methods that will dispatch the different calls from the frontend to the right part of the code in the backend. As a security measure, in order to prevent external people to trigger our servers, the API requires to be connected via our Cognito to accept any requests.

AWS API Gateway
As explained in the part of the technical challenge above, we store in S3 all the map data we need for the calculations so they are easily and permanently available.
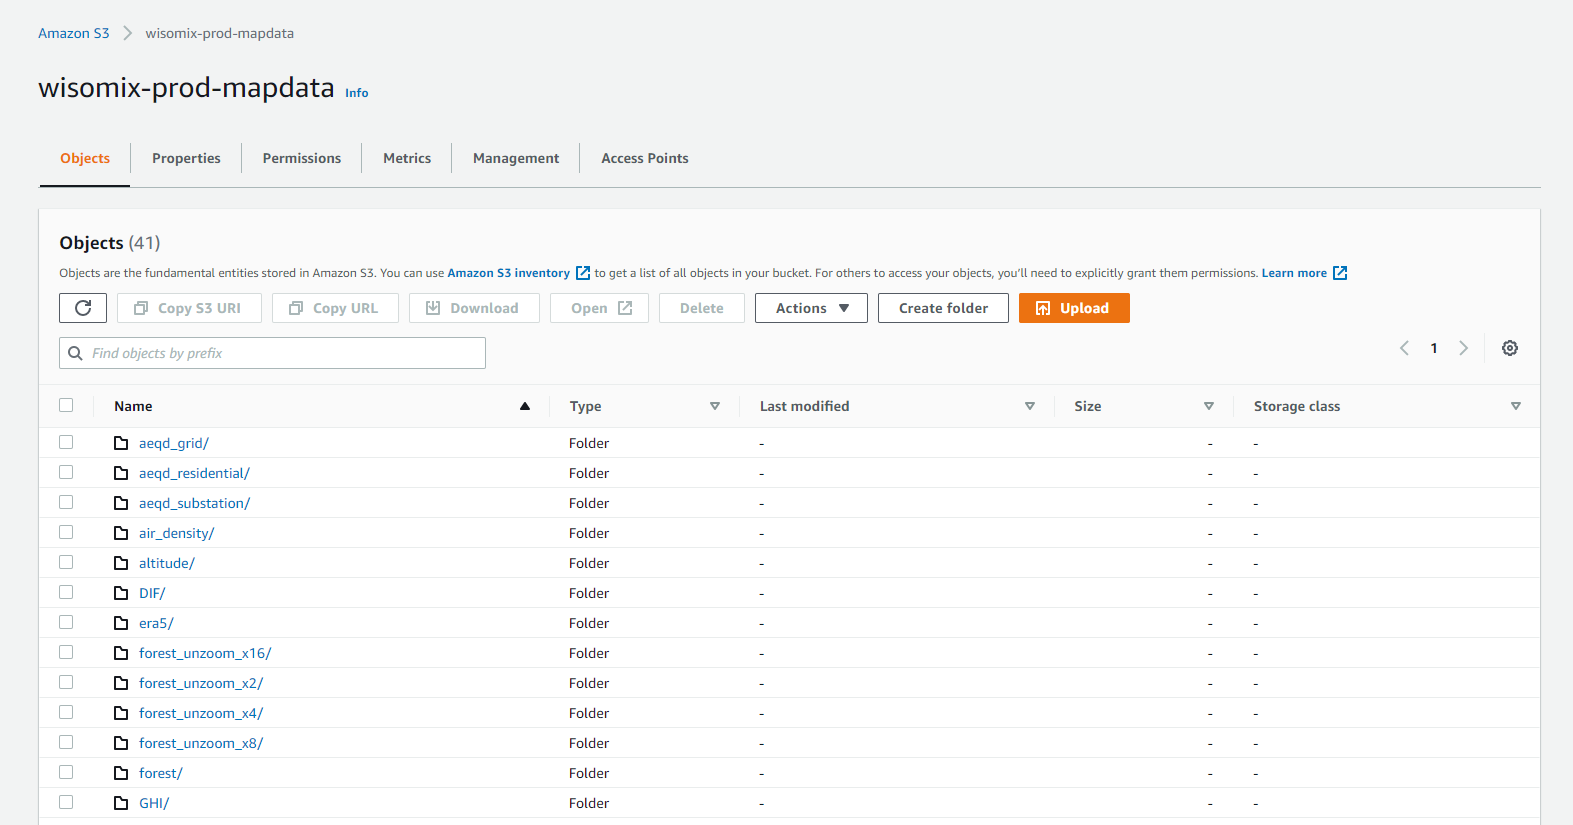
AWS S3 - map data
Here is an example of the code uploaded to Lambda.
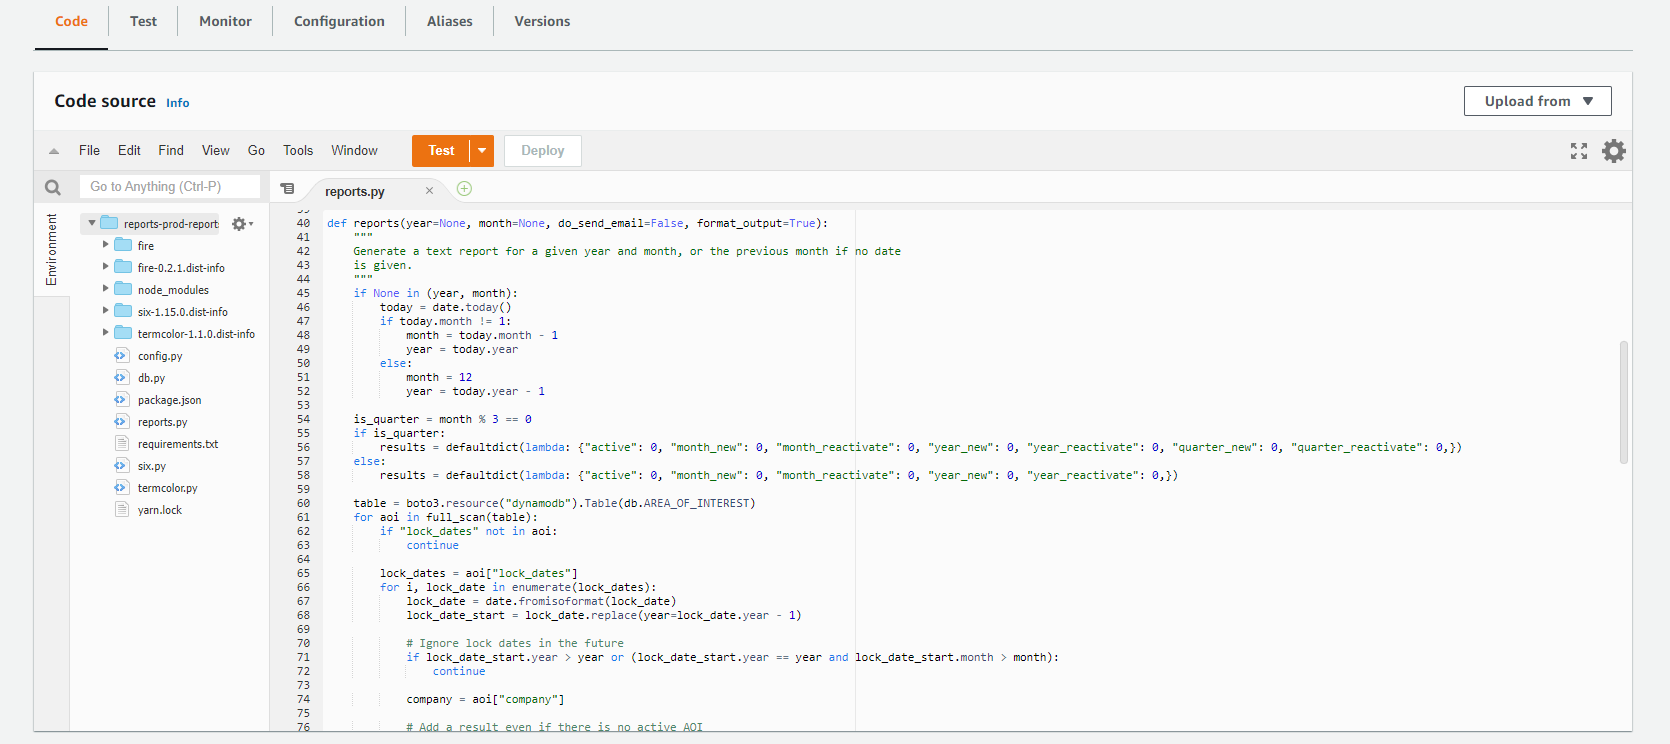
AWS Lambda
The outcome of the code are JSON files created in another S3 bucket that are then sent to the frontend so users can view and access their results. Each user has its own folder to maintain data protection and it makes it easier to find specific files when we are debugging for example.
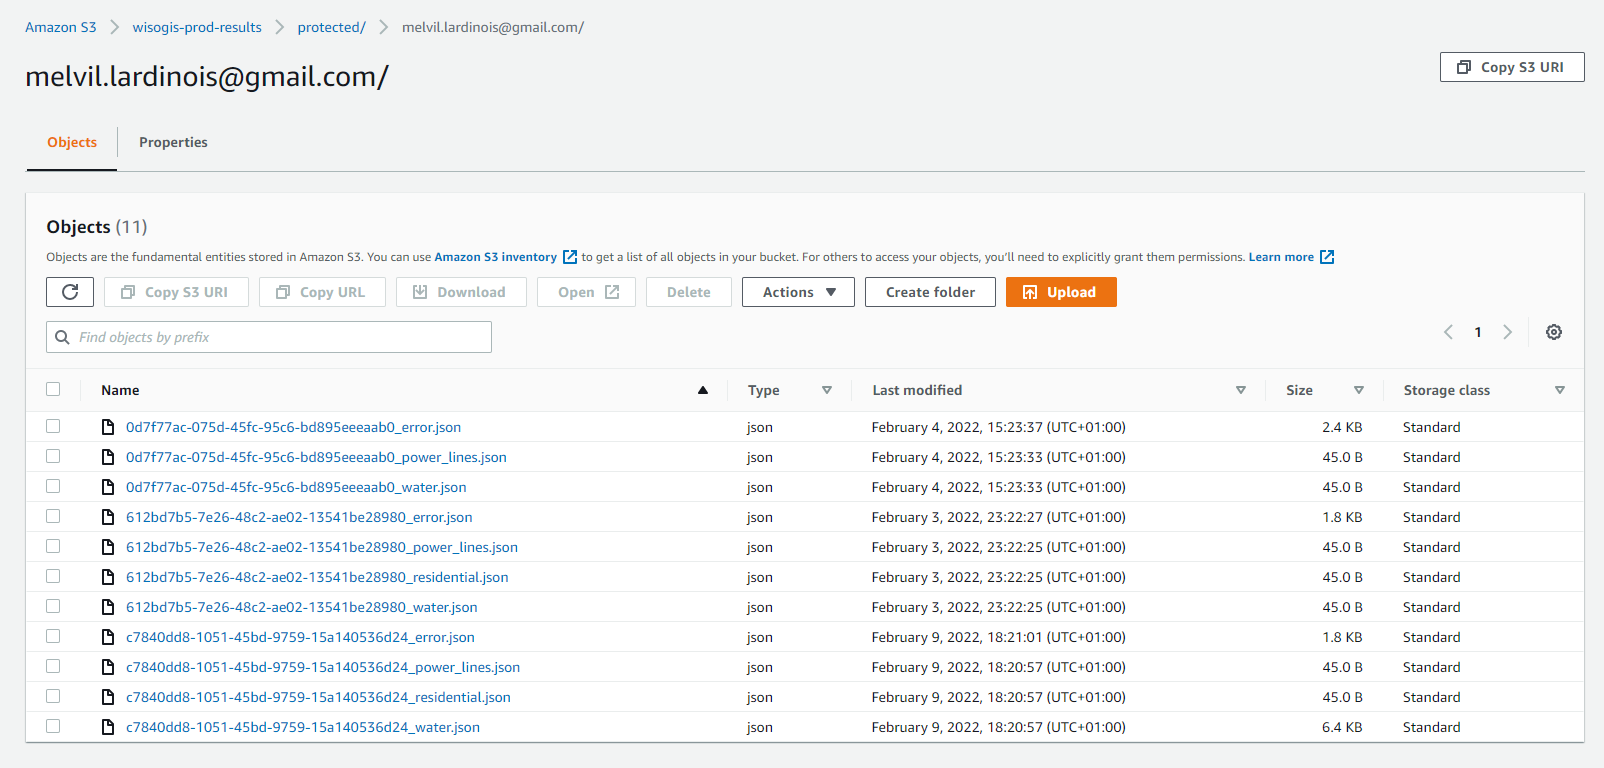
AWS S3 - user data
necessaryUser settings input are also saved in a NoSQL database so we can access them if necesserary when loading previous calculations.
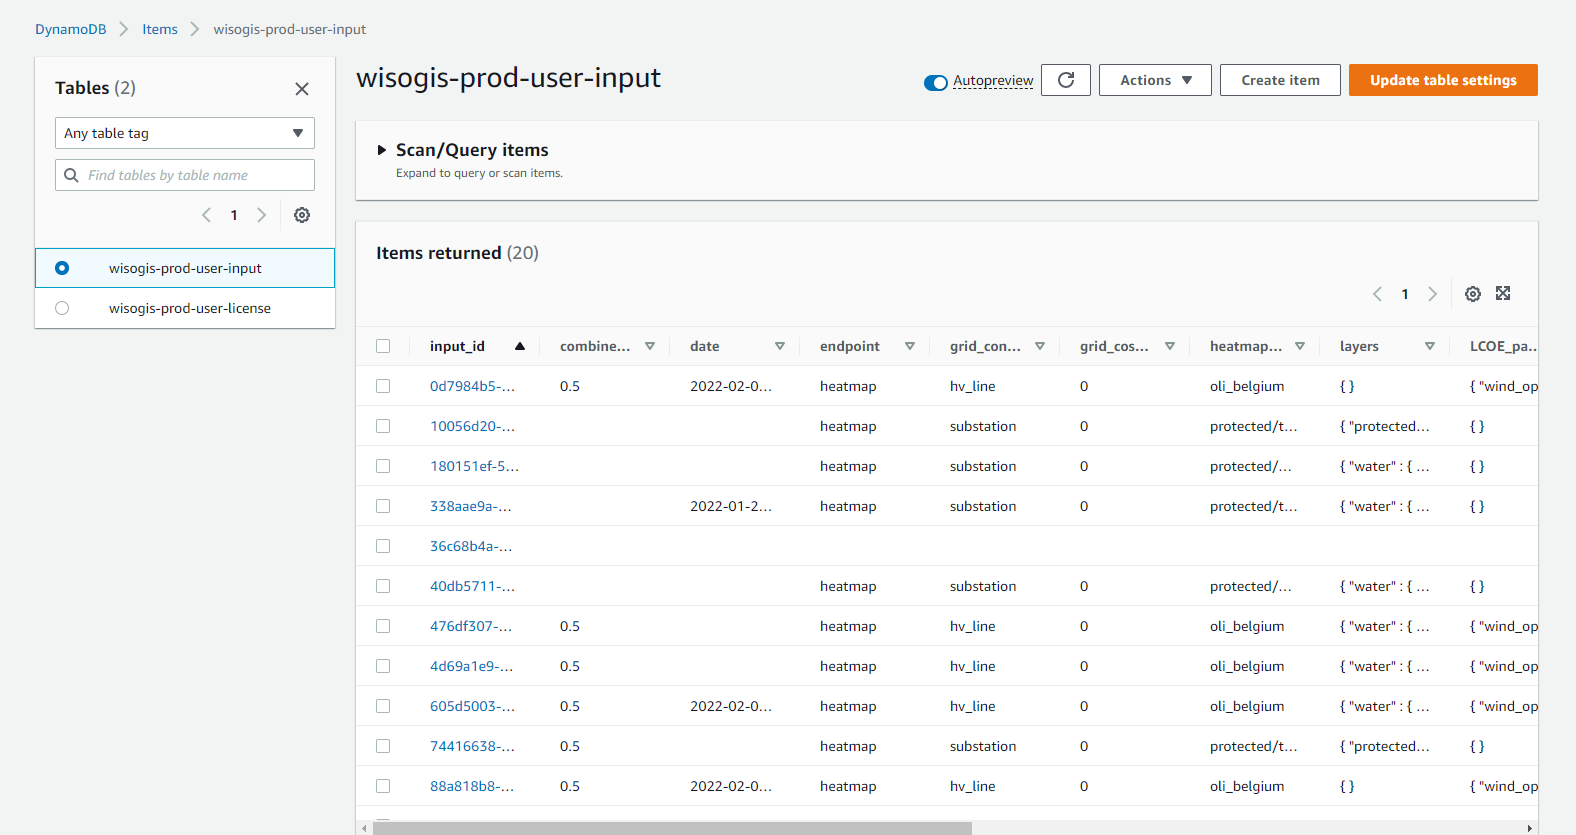
AWS DynamoDB
All of these services (apart from S3) are pay-per-use, meaning that the monthly AWS billing will be correlated with how much clients have used the application during that period of time.
It is crucial to take this billing into consideration when deciding on the pricing of the app to make sure that it will be covered by the sales in order to be profitable.
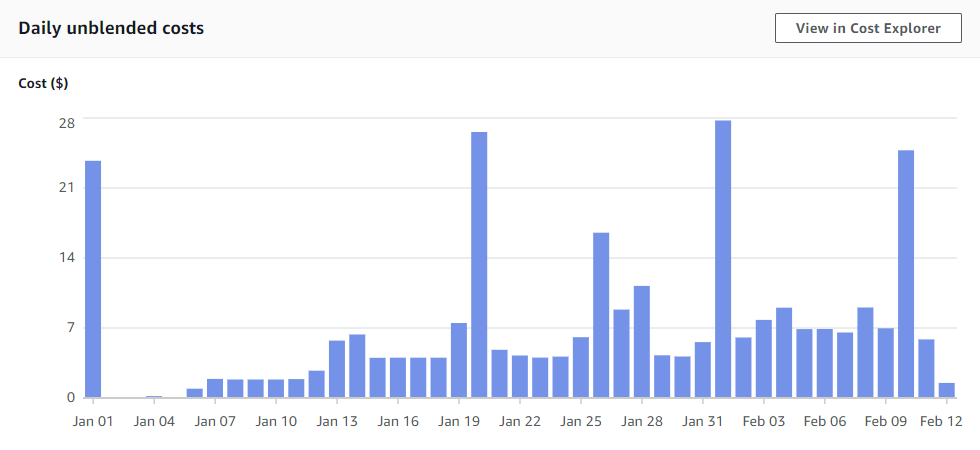
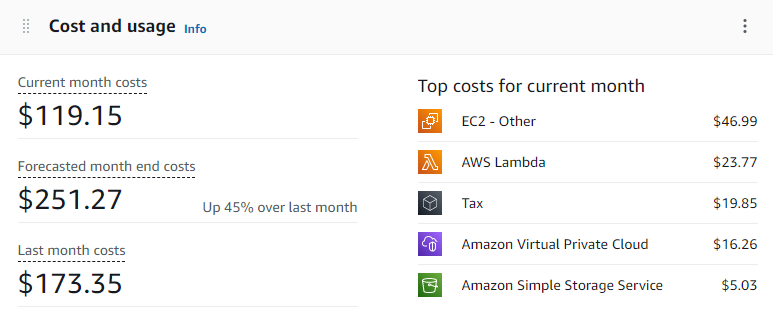
Cost and usage example
It is possible to set up limits and alerts to be informed when the usage rate of services reaches specific values. Moreover, if you want to deliver more information to coworkers of don't have access to the AWS account, you can build Kibana dashboards to gather reports on clients' behavior on the application or monitor the health of the servers for example.
We carried out a 5 month Beta phase that went well and we used users’ feedback to establish a new backlog. We are working on a new big update to start commercializing Wisogis, with a target delivery date of Q3 2022 🚀.